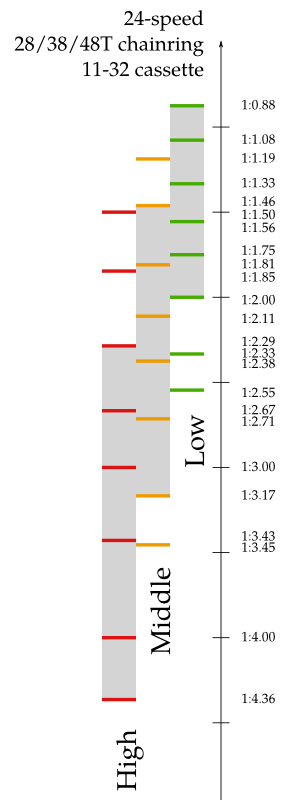
Bike gearing visualized
I’ve wanted to draw this diagram since my father first explained bicycle gearing to me, but I must have been too lazy. I just replaced the rear gear cluster on my bike and found that the sprockets even had the number of teeth stamped on them, which destroyed my last feeble excuse about not wanting to count the number of teeth.
In this diagram, higher (faster and more difficult) gears are further down; low gears are at the top. Gray bars represent the range which is actually usable - which excludes the extreme ends where the horizontal offset between the front and back gears becomes large.
For the nerdy folks, here’s a little MATLAB script I used to help generate the diagram:
% Input - number of teeth on front and back
front = [28, 38, 48];
back = [32, 26, 21, 18, 16, 14, 12, 11];

% Calculate the ratio
[frontrep, backrep] = meshgrid(front, back);
ratio = frontrep ./ backrep;

% Sort the ratios
flat = reshape(ratio, [1, numel(ratio)]);
[sorted, idx] = sort(flat);

% Pull out the gear indices from the sorted list
frontnum = ceil(idx / length(back));
backnum = mod(idx, length(back));
backnum(backnum == 0) = length(back);

% Put it all together and print the sorted result
result = [frontnum', backnum', sorted'];
fprintf("%d:%d %f\n", result')
I also used MATLAB to generate some SVG code which I then edited in Inkscape to create the final diagram. The full code is here.